Spicing up your app’s performance - a simple recipe for GC tuning
The garbage collector is a complex piece of machinery that can be difficult to tune. Indeed, the G1 collector alone has over 20 tuning flags. Not surprisingly, many developers dread touching the GC. If you don’t give the GC just a little bit of care, your whole application might be running suboptimal. So, what if we tell you that tuning the GC doesn’t have to be hard? In fact, just by following a simple recipe, your GC and your whole application could already get a performance boost.
This blog post shows how we got two production applications to perform better by following simple tuning steps. In what follows, we show you how we gained a two times better throughput for a streaming application. We also show an example of a misconfigured high-load, low-latency REST service with an abundantly large heap. By taking some simple steps, we reduced the heap size more than ten-fold without compromising latency. Before we do so, we’ll first explain the recipe we followed that spiced up our applications’ performance.
A simple recipe for GC tuning
Let’s start with the ingredients of our recipe:

Besides your application that needs spicing, you want some way to generate a production-like load on a test environment - unless feeling brave enough to make performance-impacting changes in your production environment.
To judge how good your app does, you need some metrics on its key performance indicators. Which metrics depend on the specific goals of your application. For example, latency for a service and throughput for a streaming application. Besides those metrics, you also want information about how much memory your app consumes. We use Micrometer to capture our metrics, Prometheus to extract them, and Grafana to visualize them.
With your app metrics, your key performance indicators are covered, but in the end, it is the GC we like to spice up. Unless being interested in hardcore GC tuning, these are the three key performance indicators to determine how good of a job your GC is doing:
- Latency - how long does a single garbage collecting event pause your application.
- Throughput - how much time does your application spend on garbage collecting, and how much time can it spend on doing application work.
- Footprint - the CPU and memory used by the GC to perform its job
This last ingredient, the GC metrics, might be a bit harder to find. Micrometer exposes them. (See for example this blog post for an overview of metrics.) Alternatively, you could obtain them from your application’s GC logs. (You can refer to this article to learn how to obtain and analyze them.)
Now we have all the ingredients we need, it’s time for the recipe:

Let’s get cooking. Fire up your performance tests and keep them running for a period to warm up your application. At this point it is good to write down things like response times, maximum requests per second. This way, you can compare different runs with different settings later.
Next, you determine your app's live data size (LDS). The LDS is the size of all the objects remaining after the GC collects all unreferenced objects. In other words, the LDS is the memory of the objects your app still uses. Without going into too much detail, you must:
- Trigger a full garbage collect, which forces the GC to collect all unused objects on the heap. You can trigger one from a profiler such as VisualVM or JDK Mission Control.
- Read the used heap size after the full collect. Under normal circumstances you should be able to easily recognize the full collect by the huge drop in memory. This is the live data size.
The last step is to recalculate your application’s heap. In most cases, your LDS should occupy around 30% of the heap (Java Performance by Scott Oaks). It is good practice to set your minimal heap (Xms) equal to your maximum heap (Xmx). This prevents the GC from doing expensive full collects on every resize of the heap. So, in a formula: Xmx = Xms = max(LDS) / 0.3
Spicing up a streaming application
Imagine you have an application that processes messages that are published on a queue. The application runs in the Google cloud and uses horizontal pod autoscaling to automatically scale the number of application nodes to match the queue’s workload. Everything seems to run fine for months already, but does it?
The Google cloud uses a pay-per-use model, so throwing in extra application nodes to boost your application’s performance comes at a price. So, we decided to try out our recipe on this application to see if there’s anything to gain here. There certainly was, so read on.
Before
To establish a baseline, we ran a performance test to get insights into the application’s key performance metrics. We also downloaded the application’s GC logs to learn more about how the GC behaves. The below Grafana dashboard shows how many elements (products) each application node processes per second: max 200 in this case.

These are the volumes we’re used to, so all good. However, while inspecting the GC logs, we found something that shocked us.
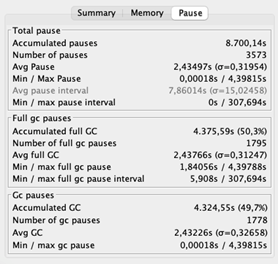
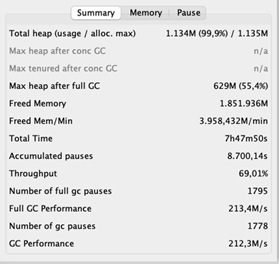
The average pause time is 2,43 seconds. Recall that during pauses, the application is unresponsive. Long delays don’t need to be an issue for a streaming application because it does not have to respond to clients’ requests. The shocking part is its throughput of 69%, which means that the application spends 31% of its time wiping out memory. That is 31% not being spent on domain logic. Ideally, the throughput should be at least 95%.
Determining the live data size
Let us see if we can make this better. We determine the LDS by triggering a full garbage collect while the application is under load. Our application was performing so bad that it already performed full collects – this typically indicates that the GC is in trouble. On the bright side, we don't have to trigger a full collect manually to figure out the LDS.
We distilled that the max heap size after a full GC is approximately 630MB. Applying our rule of thumb yields a heap of 630 / 0.3 = 2100MB. That is almost twice the size of our current heap of 1135MB!
After
Curious about what this would do to our application, we increased the heap to 2100MB and fired up our performance tests once more. The results excited us.
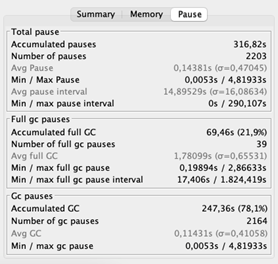
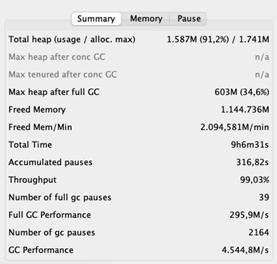
After increasing the heap, the average GC pauses decreased a lot. Also, the GC’s throughput improved dramatically – 99% of the time the application is doing what it is intended to do. And the throughput of the application, you ask? Recall that before, the application processed 200 elements per second at most. Now it peaks at 400 per second!

Spicing up a high-load, low-latency REST service
Quiz question. You have a low-latency, high-load service running on 42 virtual machines, each having 2 CPU cores. Someday, you migrate your application nodes to five beasts of physical servers, each having 32 CPU cores. Given that each virtual machine had a heap of 2GB, what size should it be for each physical server?
So, you must divide 42 * 2 = 84GB of total memory over five machines. That boils down to 84 / 5 = 16.8GB per machine. To take no chances, you round this number up to 25GB. Sounds plausible, right? Well, the correct answer appears to be less than 2GB, because that’s the number we got by calculating the heap size based on the LDS. Can’t believe it? No worries, we couldn’t believe it either. Therefore, we decided to run an experiment.
Experiment setup
We have five application nodes, so we can run our experiment with five differently-sized heaps. We give node one 2GB, node two 4GB, node three 8GB, node four 12GB, and node five 25GB. (Yes, we are not brave enough to run our application with a heap under 2GB.)
As a next step, we fire up our performance tests generating a stable, production-like load of a baffling 56K requests per second. Throughout the whole run of this experiment, we measure the number of requests each node receives to ensure that the load is equally balanced. What is more, we measure this service’s key performance indicator – latency.
Because we got weary of downloading the GC logs after each test, we invested in Grafana dashboards to show us the GC’s pause times, throughput, and heap size after a garbage collect. This way we can easily inspect the GC’s health.
Results
This blog is about GC tuning, so let’s start with that. The following figure shows the GC’s pause times and throughput. Recall that pause times indicate how long the GC freezes the application while sweeping out memory. Throughput then specifies the percentage of time the application is not paused by the GC.
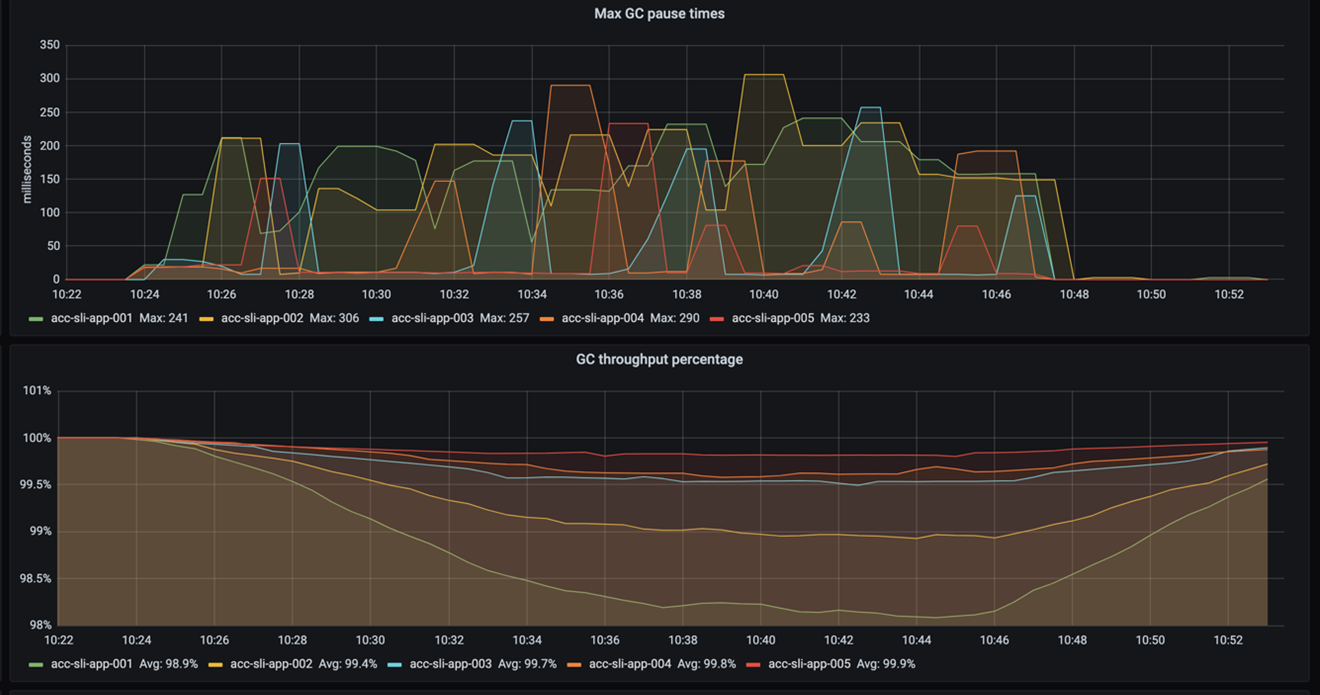
As you can see, the pause frequency and pause times do not differ much. The throughput shows it best: the smaller the heap, the more the GC pauses. It also shows that even with a 2GB heap the throughput is still OK – it does not drop under 98%. (Recall that a throughput higher than 95% is considered good.)
So, increasing a 2GB heap by 23GB increases the throughput by almost 2%. That makes us wonder, how significant is that for the overall application’s performance? For the answer, we need to look at the application’s latency.
If we look at the 99-percentile latency of each node – as shown in the below graph – we see that the response times are really close.

Even if we consider the 999-percentile, the response times of each node are still not very far apart, as the following graph shows.

How does the drop of almost 2% in GC throughput affect our application’s overall performance? Not much. And that is great because it means two things. First, the simple recipe for GC tuning worked again. Second, we just saved a whopping 115GB of memory!
Conclusion
We explained a simple recipe of GC tuning that served two applications. By increasing the heap, we gained two times better throughput for a streaming application. We reduced the memory footprint of a REST service more than ten-fold without compromising its latency. All of that we accomplished by following these steps:
• Run the application under load.
• Determine the live data size (the size of the objects your application still uses).
• Size the heap such that the LDS takes 30% of the total heap size.
Hopefully, we convinced you that GC tuning doesn't need to be daunting. So, bring your own ingredients and start cooking. We hope the result will be as spicy as ours.
Credits
Many thanks to Alexander Bolhuis, Ramin Gomari, Tomas Sirio and Deny Rubinskyi for helping us run the experiments. We couldn’t have written this blog post without you guys.