Our ride to peak season frontend performance
We can imagine that at a regular company your colleagues might become very nervous when you worsen the frontend performance by more than a second on the onload, just before the peak season. In this story we'd like to share our journey from experiencing a setback in performance that was caused by us innovating, to the point where we became the retailer with the second fastest frontend response times (Twinkle and Computest benchmark study) in the Netherlands.
Cake!

Before diving into the details, it's worth mentioning that we as software engineers at bol.com are extremely lucky to have a stable and fast responding backend. So at the beginning of August we had a fantastic basis to build on. However at that point we had enabled our new javascript build based on webpack. This new build showed degraded performance characteristics when compared with our previous maven and google closure compiler based setup.
At that moment in time we had to make a decision. Either move forward with our implementation, which is future-proof and allows future innovations, or take a step back and return to the old setup, which is faster? We decided to free up some people and tackle the problem. We started our journey trying to understand what happens in the browsers of our users, think of an hypothesis, experiment to improve or to gain more knowledge. At the beginning of the peak season we were quite confident we would perform on par or at some places even better than the old implementation. We didn't expect to score so well that we even received cake showing us ranking second!
Investigate, form a hypothesis
Historically for our frontend performance we’ve always focused on the onload metric. This represents (by rough estimation) the moment that the page has loaded all assets and is visually complete. Also, when comparing our metrics with the measured ‘response times’ from the benchmark study these look very similar.
Diagnose the problems
To investigate performance problems we used several tools. They helped to quickly diagnose problems and investigate hypotheses. We extensively used our private WebPageTest (WPT) instance, Google Chrome browser devtools and the Lighthouse auditing reporting.
While these are all great tools, there is an interesting thing Dijkstra once said; “the tools we are trying to use and the language or notation we are using to express or record our thoughts, are the major factors determining what we can think or express". We believe this is worth mentioning because we ran into this. All these tools are based on Chrome/Chromium. We saw that code changes had the most effect in Chrome, but did way less in other browsers. Meaning that over time the performance in Chrome got a lot faster while others stayed behind. This is something to keep in mind, especially when you are focusing on improving certain performance metrics.
This is where real user monitoring (RUM) becomes very useful. When we started this project we already had metrics and reporting of the actual performance at that moment. So we knew our initial change made the whole webshop slower. Right now, the reporting distinguishes our metrics on two factors; page type and device (mobile vs. desktop) on both 90th and 99th percentile. For further analysis our RUM tool lets us filter based on more dimensions. This allows further drilling down based on for example browser type or connection. This can really help to find issues concerning specific pages or elements.
Experiment safely
For example, based on the RUM reporting we noticed a specific experiment we were running had slower frontend load times than the old version. Using WebPageTest and Lighthouse to debug the issue we found out that the resource hints weren’t sent correctly. This was a simple thing to fix. Within our process we really like to keep changes as small as possible, verify its effect in a controlled environment, bring it to production, and see its effect in the real user monitoring.
Typically we use WPT to verify the effect of our change on a feature environment (this is like a small test environment specific to a certain feature branch). This lets us verify the effect and to plan our next moves. If the effect satisfies us, we do a small risk assessment (what can possibly go wrong?). Then we get the change deployed to our consumers as quickly as possible. The webshop codebase is deployed on a daily basis and given the fact that we have quite some visitors, feedback is quick. We guard riskier changes with feature switches. When functionality breaks or performance degrades because of a change, we can quickly turn it off. We can even canary switch a feature, which means the feature will be on for roughly 8% of traffic.
Applying HTTP streaming
In theory web performance is easy. Bottom line: the browser needs data to determine what to show. So the faster the browser receives data, the faster there will be a visible result for the customer. However, we found out that how the browser receives this data makes plenty of difference.
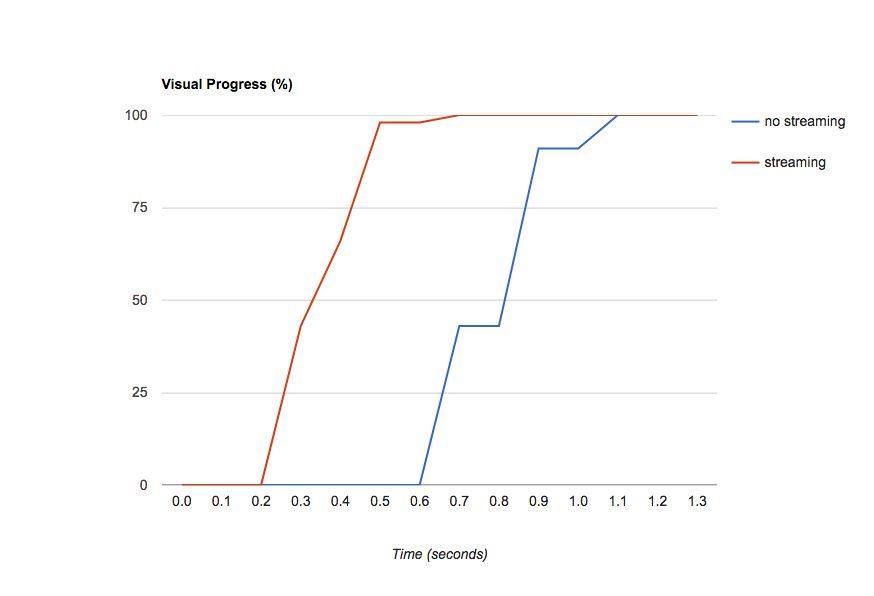
Figure 1. Visual progress comparison measured in WPT

Figure 1 shows the effect on the visual progress between utilizing HTTP response streaming or chunking and without. With this technique we can construct the response as part of smaller packages of the document. Without this, we let the backend create the complete document and then send it as a complete response. Because the browser can already stream this response before it has received the closing </body> tag of the document, it can read and print the navigation header, start rendering the content and so on. The browser can also load assets (such as images, styles and scripts) in parallel, while the backend still has to do service calls to build additional parts of the page. This will result in the browser being able to display visual content quicker and this improves the perceived performance.
Getting it implemented
This idea of HTTP streaming is not new, and well explained on the web. However setting this up for us proved to be tricky. Our (Handlebars oriented) template rendering layer (internally developed) was engineering from the bottom up with this technique in mind. Meaning that all field variables in our templates are lazy evaluated, and only calculated until the render engine passes them. This is then directly sent back to the client. However the connection between the rendering layer and our application code was setup in an imperfect way and in other places we’re required to explicitly force our backend to start flushing.
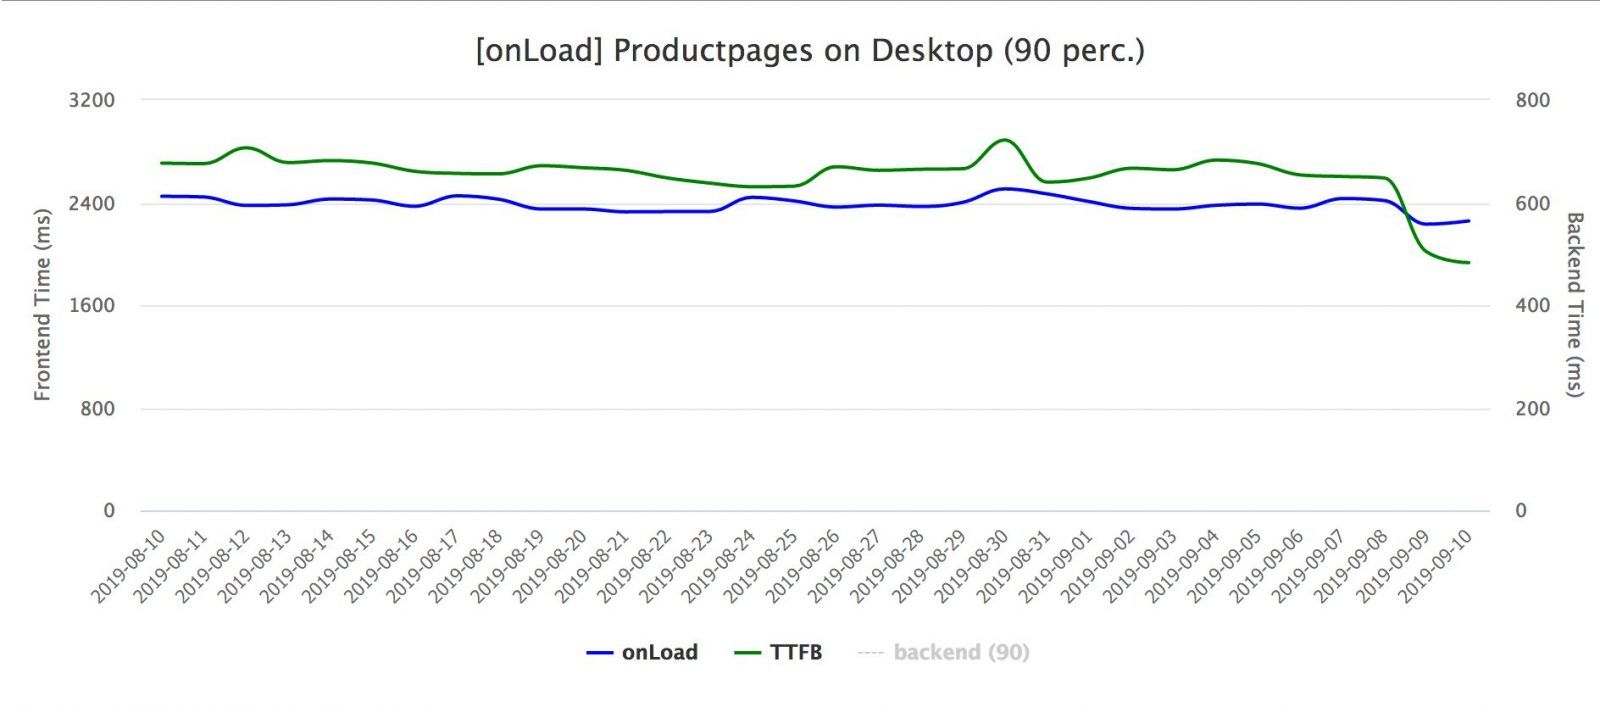
The effect of this change for the real user was less impressive than what WPT showed us in figure 1. For real users this change lowered the page load metric (90th percentile) by about 200ms as seen in figure 2. Notice how the green line, which represents the TTFB (time till first byte), also improves when we started making better use of the HTTP streaming.
Figure 2. Page load metrics for product page measured on the client (RUM)

.. but be careful!
It’s important to note that HTTP streaming has several caveats. First of all this technique is mostly applicable to HTTP/1.1. While HTTP2 still streams, it works slightly differently. It requires a well-considered backend structure. For example, you should try to delay service calls until needed for rendering, but doing this without thought can result in multiple service calls. Another caveat is that especially in the case of HTTP/1.1 we cannot send headers anymore after we started sending the body of the document. This can be an issue if the result of a backend call defines headers such as the Status Code.
Less is more
After applying the change with HTTP streaming, performance already looked much better.But we didn’t want to stop there. In total between early August and late December we shipped around 30 changes. Some of them often looked promising during local testing, but once on production it often delivered less performance gain then we hoped for. Others however were unexpected performance improvements which emphasize the importance of having good real user metrics even more.
Avoiding the cost of javascript
To give a small idea of the changes; we removed a library that was loaded on every page and depended on `@babel/polyfill`. We found in the chrome devtool that it was one of the slowest parts to execute, mainly because of its file-size. While this is not super surprising, this was partly a problem because of our setup. But we also never paid much attention to it and didn't need much of the functionality it provided, so we opted to include only the parts of the polyfill we wanted/needed. Especially in the upper 90th percentile the removal of this library was very noticeable.
Numerous changes were very small, but we cleaned up around 3.5k lines of javascript code. Another trick in the book was to move loading additional javascript code behind click or scroll interactions and delay running it until critical visual updates were done. Now that we use webpack in production, this also can be solved much more elegantly.
Use javascript to improve the user experience
Most of our changes only improved our metrics which is cool for us, but is hard to measure on ROI. We did A/B test one of the optimizations: delaying the moment we load the off-screen images. With this we improved the time till interactive and conversion. One funny thing to mention here is that we initially implemented this with support for the new lazy loading API Chrome provides. However the AB test shows (since the feature landed right in the middle of the AB test) this actually wasn't an improvement in comparison with our own implementation. We hope to retest this in the future to improve our understanding. And for the real connoisseur, our current implementation tracks in-view with an Intersection Observer wrapped in a small Custom Element.
Looking forward
Backend development already has a very performance minded culture, and we are planning to improve this on the frontend too. We believe that this way of thinking towards performance will pay off, by making engineers care about performance instead of it being an afterthought. However, we won’t be able to do this without further investing in our tools. We want to improve our synthetic monitoring and add determining factors on our RUM measures. This in combination with better processes (embedded in a SRE-like way of working). On an infrastructure level we are currently working to get both HTTP2 and brotli compression working.We’re also investigating the usage of a CDN for our assets, for which we have high expectations.
Last but not least, to be honest there was some small disappointment on being only second in class. So, we don't know if Twinkle and Computest will conduct a second benchmark, but we are aiming for the number one spot. We want to thank both Twinkle and Computest for conducting the benchmark study and the cake. Hopefully we can share more about growing our frontend performance minded culture in the future.