From database killer to top performer!
How do you get the IT management board to serve you coffee on a golden platter? You have to do something good of course, exceptional in fact. In order to tell you how we became top performer instead of database killer by creative use of a cache, we will have to take you back to December 2015, when it all started.
December. The most wonderful time of the year. Here at bol.com it is also the busiest time of the year, with more than 7 million customers looking for presents on the bol.com website. The pressure on our systems is extremely high and so is the pressure on us developers who built these systems. Especially, when your system is being pushed to the brink of collapse under the extreme load. This happened to us back in 2015.
How things turned bad
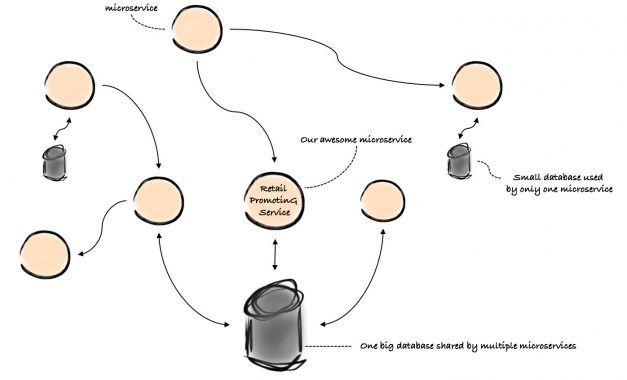
To understand how things turned bad, we first have to tell you a bit more about our architecture. Microservices dominate our architectural landscape. Most microservices use their own private database nowadays, but back in 2015 quite a few services were still using one big, shared, relational database. So was our retail promoting service, as you can see in the picture below.

The main responsibility of the Retail PromotinG Service – RPG for short – is to promote discounted products. RPG has different ways of promoting such products. One of them is to show a stamp on the discounted product, for example:

For each product viewed by a customer on the bol.com website, the website asks RPG for a stamp. During the 2015 season, these stamps were so popular that the RPG became the number one heaviest database user. It was hammering the poor database with close to 5,000 queries per second. IT director Feike Groen can still clearly recall "sitting on the couch with 'clenched buttocks', watching the database CPU usage rise". The database almost collapsed. Could you imagine what would have happened to all those other services if it would have? We really had a narrow escape there.
How we made RPG great again
The following year, we decided to compete for a more honorable prize than being the top database user.
Let the metrics tell the tale
If you want to know how well your service is doing, you should at least know what it is doing. So, we started with creating Grafana monitoring dashboards for the RPG and let the metrics tell the tale. They help us answer vital questions, such as how many errors our service throws, how many queries it executes and how much memory and CPU it consumes.
We start each day with interpreting and analyzing the dashboards with the whole team. This way we know what is going on. Do we see (negative) trends in the performance? Do we see an increase of errors? Why?
Only spotting negative trends once they occur on production could be a bit risky, of course. Therefore, we run a daily performance test on the acceptance environment. We run it with a load that is higher than the load we expect for the season. This way we catch errors and performance drops before they land on production.
Because of this habit our service remains healthy and free from errors on production every day.
To query or not to query
You can probably guess by now which dashboard we have been staring at the most. It is the one showing the number of query executions for fetching stamps.
We looked at all three stamp queries to see if we could optimize them. It turned out that they were already performant. The problem lay in the number of times they were executed. Further investigation revealed that two out of three queries were merely fetching data from master tables with just some records of stale data. Did we really have to query the database for that? Couldn’t we just hardcode it in the service? We did just that.
Two queries down, one to go.
Honey? I burned the CPU!
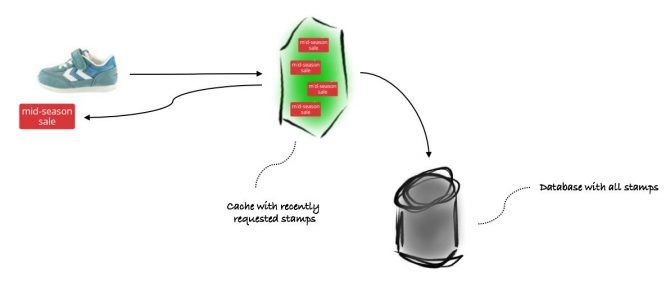
And the last query happened to be the tough one. We first tried to reduce the burden on the database by caching stamps. The process is simple. If a client asks for a stamp for a product, we look up the product in the cache. Is it in the cache? Good, return its stamp. No? Too bad, query the database and add it to the cache if a stamp is returned.
Of course, not every product has a stamp. Only a few of the millions of products we have actually do. When a product cannot be found in the cache, this can mean two things: 1) the product has a stamp, or 2) the product does not have one. To distinguish between the two, we have to query the database. For the first case the product and stamp are returned, whereas for the second the result is empty. Therefore, we also had to cache products without a stamp. Would we reduce the number of queries to the database if we wouldn’t have?

We expected to see the number of queries to the database decrease once we deployed the cache. Indeed, our dashboards showed a decrease of around 20%. A good result, but we hoped for a bigger improvement. We started with a cache that could hold 50 thousand products. Bigger is better we thought, so we incrementally enlarged the cache: 100 thousand, 250 thousand and 500 thousand. Each increase gave us a better cache hit ratio and less database calls. We got a bit too excited and pumped the cache up to 2.5 million. The JVM kindly told us that that was too much by melting down the CPU.
With just a few weeks to go until the season we still hadn't reduced the number of database queries enough. We really had to come up with something smart now.
Stamps, gotta cache 'em all
We learned that the more products we cache the less queries the database executes. What we also learned is that no cache can possibly be big enough to hold all those millions of products we have. That made us wonder: do we really need a cache that big for just those 200 thousands product stamps?
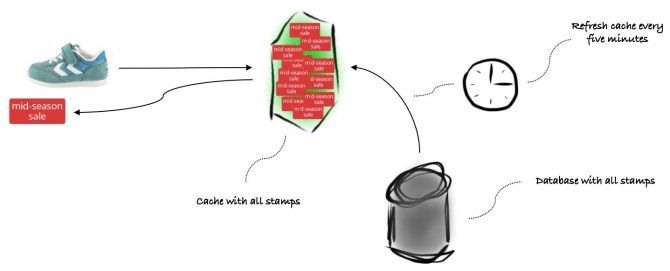
No, we don’t. We just need one that’s big enough for all our stamps. We gotta cache them all! If we ensure that all product stamps are in the cache, a cache miss means the product does not have a stamp. This way we no longer need to query the database when the website asks for a stamp.

With the limited time we had left we could not afford a complete overhaul of the design and use, for example, an in-memory database. We decided to (ab)use the cache as an in-memory database. When the website asks for a stamp we do not add it to the cache. Instead, we pro-actively push all stamps from the database into the cache. We configured a cronacle job to perform this task every five minutes.
Pushing stamps to the cache was not the real challenge, deleting them was. A cache is generally not designed to delete items from. We overcame this limitation by using the concept of item expiration. The cache marks items that are not retrieved for a defined period as expired. The cache does not immediately remove expired items, but also does not return them. It will remove them when it receives a request for that item. We set the item expiration time to fifteen minutes. Now, the cache automatically removes deleted stamps from the database after at most fifteen minutes.
RPG first!
We reduced the number of database calls from 5,000 per second to one per five minutes. As an added bonus, the average response time of our endpoint improved to no more than 1 millisecond. We were no longer in the top three of heavy database users. Instead, we earned ourselves a spot in the top ten of the fastest endpoints of bol.com.
The moral of the story is thus that while it is true that ignorance is bliss, actually getting to know your service intimately, with all its quirks and shortcomings, opens up a world of possibilities. You may get to fix things you never knew were broken and improve it in such a way that it even becomes a top performer. Somewhere out there is a Grafana dashboard with your service’s name on it. If you haven’t done so already, go on, give it a go. You might just as well wake up with the smell of coffee being served to you on a golden platter.
Thanks to all (former) team members for contributing to this post: André Kritzinger, Ivan Jovanovic, Nikola Milevojevic, Maurice van Huijssteeden and Sandra Schugens!