My baby was leaky and now it’s not
When you build a service at bol.com your responsibility doesn’t end once the build is green. You’re actually supposed to run it (and keep it running) in production, too. Luckily, our team doesn’t have to do this all by ourselves: there are platform and infrastructure teams to turn to and other development teams to harass over coffee.
It’s a bit like caring for a newborn baby I suppose: you try to do a lot yourself but when the baby starts crying for the first time you’ll need all the help you can get. This is what happened to our team's Java service, too. On one of the busiest nights of the year it crapped out and refused to send any more orders to our warehouses. Turns out we had a leak and, much like with a baby, it’s probably best to clean those up immediately. (I’m also ending the baby analogy here, since the rest of this blog post talks about things like “heap dumps” and, well…let’s just drop it)
Where’s the leak?
We had very little information to go on when starting our investigation into the cause of our memory leak. We knew our service had run out of memory and that was pretty much it. We needed more input.
Thankfully, the friendly folks in operations can create heap dumps for us. These are less gross than they sound. They’re a snapshot of the heap memory of your running process and can be created on-the-fly, even when your service is running. The dumps can tell us which objects are allocated and, usually, find the objects they relate to and even which part of the call stack allocated them.
To view them you can use tools like VisualVM which is free, or YourKit, which is not.
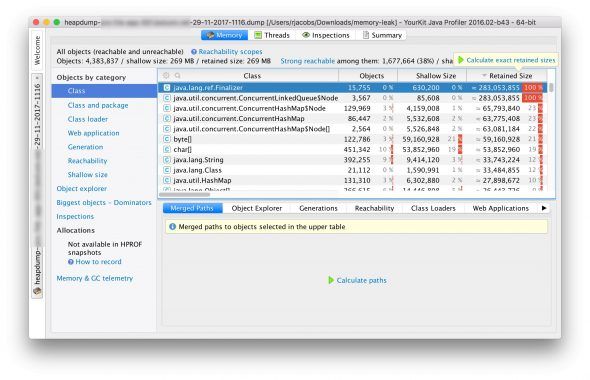
So, let’s open the heap dump. It’ll look like this:

What you’ll see is that there are a couple of classes that have a very large “retained size”, at around 280 MB. The retained size is the amount of memory that would be left after a GC run. So, if your service would almost be out of memory, a mark-and-sweep GC would be triggered. This would not reclaim any of this 280 MB, though!
The question for me is: is this 280 MB expected? If I look at this list I have no idea if we really need that many nodes in our ConcurrentLinkedQueue. Why do we even have a queue like that? Are those “finalizers” related? Who knows. Basically, I still have no idea what I’m looking at here.
What these memory profiling tools allow you to do, though, is compare two snapshots. So I can just ask for another heap dump a couple of hours later and then I can get a diff! Looking at differences is going to tell me much more, so let’s load up that new heap dump and compare it to the previous one:

Gah! Compared to a couple of hours ago we seem to have created nearly 48,000 lock objects. Now, I’m not sure if that’s the full cause of our memory consumption but that sure seems like a leak! So now I have something to go on: I’m going to investigate if there’s something wrong with the way we handle locking.
How does our locking work?
We use Hazelcast to handle distributed locks in our service. A distributed lock is like a mutex except across network nodes. Among other things, we use it in our service to make sure that we don’t process shipments for the same order simultaneously as that could cause data races in our database: a write in one thread could potentially overwrite data written by another thread.
We’ve wrapped the distributed locks in a simple interface. This way we can choose to use a Hazelcast-based implementation or, in our unit tests, a dummy implementation.
The (simplified) interface looks like this:
public interface DistributedLocker {
    void lockAndPerform(final String lockKey, Runnable fn);
}
And you would use it something like this:
locker.lockAndPerform("order-123", () -> { /* do some processing */ });
The code above simply makes sure that when we process order 123 we have a lock around it. We have a naming convention around this, so everywhere we process orders we’d generate this “order-123” lockKey in the same way.
So how does this cause a leak? Let’s take a look.
The leak
This is the way we implemented the Hazelcast version of our DistributedLocker interface:
public class HazelcastDistributedLocker implements DistributedLocker {
    @Inject
    private HazelcastInstance hazelcast;

    @Override
    public void lockAndPerform(String lockKey, Runnable fn) {
        ILock lock = hazelcast.getLock(lockKey);
        lock.lock();
        try {
            fn.run();
        } finally {
            lock.unlock();
        }
    }
}
It gets a lock, actually locks it, runs my block of code (“fn”) and then unlocks the lock. The unlocking happens in a “finally” block so it gets unlocked even if fn throws an exception.
This looks pretty legit, right? Done and done. Ship it! (etc)
Well, hold on. Let’s take a look at a tiny snippet of Hazelcast documentation hidden in the “Understanding Lock Behavior” section of the Locks:Locks are not automatically removed. If a lock is not used anymore, Hazelcast will not automatically garbage collect the lock. This can lead to an OutOfMemoryError. If you create locks on the fly, make sure they are destroyed.We…didn’t do that. Every time we call “getLock” with a lockKey that is not known yet, we’d be creating a new lock! Now, if you consider that we pretty much have a lock-per-order (because the lockKey is “order-”, if you remember), we’re creating a lot of locks continuously and never cleaning them up.
But wait! The fix is easy. According to the documentation we just have to “make sure they are destroyed”. This is probably a trivial fix, so let’s just…
Why the trivial fix won’t work
It turns out that destroying a lock is pretty hard to do. Well, not the actual code for it. The code to destroy a lock is:
lock.destroy();
But this doesn’t actually do what we want. Let’s recap what we’re doing and let me then try to explain why it’s so hard.

- We’re adding locks to make sure we don’t do simultaneous processing on the same order, so we don’t overwrite any data (that’s good)
- The lock doesn’t get garbage collected (that’s bad)
- We can destroy the lock and reclaim the memory (that’s good)
- Any other thread that’s waiting for that lock to become available blows up (that’s bad)
That last step is important! The whole reason we have these locks is because they’re being used in multiple places at the same time.
Let’s take a look at a concrete example: When you have two threads that are trying to process the same order, the sequence could look like this:
- Thread A acquires lock “order-123”
- Thread B wants to acquire lock “order-123”, but has to wait
- Thread A does some processing generating tons of business value
- Thread A releases the lock
- Thread B can now acquire the lock
- Thread B does some processing generating even more business value
- Thread B releases the lock
If, at the end of step 4, we destroy the lock then step 5 will blow up and cause an exception: Thread B wants to acquire a lock that doesn’t exist anymore!
What we would have to do is destroy the lock after step 7. Let’s call that step 8. Except…what if in the meantime, between step 7 and 8, Thread C has appeared and is also waiting for the lock now? Now that thread will blow up.
I was already underway working on some kind of background thread that would put all used locks in some kind of distributed queue and then expire them after 5 minutes of non-use. This would probably have ended up becoming a headache somehow.
It turns out there is a simpler way.
Map-based locks
My colleague Bram pointed out that Hazelcast has the concept of a distributed map. It works like a map, but all the machines in your cluster share it, basically.
If you look at the API of this map, you’ll find:
public interface IMap {
    ...tons of stuff about insert and removing values...
    void lock(K key);
    void unlock(K key);
}
Great, more locking functionality! So you can lock on an arbitrary key. Does that key need to even be present in the map? Turns out it doesn’t! So we can just use our lockKey like we did before.
More importantly though, does it clean up the locks? It does! The section on “pessimistic locking” says: The IMap lock will automatically be collected by the garbage collector when the lock is released and no other waiting conditions exist on the lock.

Nice.
So we changed our DistributedLocker implementation to create a dummy map and then just lock on that:
public class HazelcastDistributedLocker implements DistributedLocker {
    private final IMap locks;

    public HazelcastDistributedLocker(HazelcastInstance hazelcast) {
        locks = hazelcast.getMap("locks");
    }

    @Override
    public void lockAndPerform(String lockKey, Runnable fn) {
        try {
            locks.lock(lockKey);
            fn.run();
        } finally {
            locks.unlock(lockKey);
        }
    }
}
Why is this a thing?
Alright, map-based locking works, but what the what, Hazelcast? Why are you even providing that regular ILock interface when you can’t really destroy the locks? How is that IMap even destroying the locks internally, then? What does it all mean?
Well, Hazelcast’s regular ILock interface seems to have a different use-case in mind than what we were using it for: instead of creating tons of locks like we were doing, the assumption is that we’d just have a couple of locks in our entire service. In our case this would mean we’d have one single “orders” lock, instead of tons of “order-” locks. We want the latter, since using a single lock effectively limits our throughput to the slowest order we happen to be processing at that time.
The answer to the second question, how does IMap destroy its locks, is pretty similar to this expiration queue I was trying to manually build. Having briefly looked at the Hazelcast code it certainly has more bells and whistles than what I would’ve built but it’s basically just queueing locks for destruction.
Finally, “Locks for Destruction” seems like the name of a song on an '80s hair metal album.
Did it help?
Yes. We solved the major memory leak we had. After we deployed the fix we still saw memory increasing, but when we manually triggered a Full GC we saw that a whole bunch of memory (what’s called “Old Gen” in the JVM) got cleaned up and we were basically back at the memory level we have on startup of the service. This indicates that the memory that we only used briefly (to process a single order) could be reclaimed and no locks remain.
Should we encounter another memory leak in the future, though, I’ll just do what I did before: Get those heap dumps, compare them in YourKit and try to reason about what’s happening.
Maybe the last question should be: Why didn’t you see this memory leak before? Well, we did. We’ve seen GC alerts in our dashboards before, but usually there would’ve been a deployment or restart (for unrelated reasons) that would’ve cleared those errors up. Because we didn’t restart our service for quite a while this leak finally popped up at the worst possible moment.
So, lessons learned:
- Don’t ignore your GC warnings too much
- Heap dump diffs are your friend
- Hazelcast locks are like hamsters: They seem friendly and fluffy, but they’ll bite you if you don’t follow the instructions