Avoiding memory leaks with Spring Boot WebClient
If you’re performing web requests with Spring Boot’s WebClient you perhaps, just like us, read that defining the URL of your request should be done using a URI builder (e.g. Spring 5 WebClient):
webClient .get()
          .uri(uriBuilder -> uriBuilder.path("/v2/products/{id}")
          .build(productId))
If that is the case, we recommend that you ignore what you read (unless hunting hard-to-find memory leaks is your hobby) and use the following for constructing a URI instead:
webClient .get() .uri("/v2/products/{id}", productId))In this blog post we’ll explain how to avoid memory leaks with Spring Boot WebClient and why it is better to avoid the former pattern, using our personal experience as motivation.
How did we discover this memory leak?
A while back we upgraded our application to use the latest version of the Axle framework. Axle is the bol.com framework for building Java applications, like (REST) services and frontend applications. It heavily relies on Spring Boot and this upgrade also involved updating from Spring Boot version 2.3.12 to version 2.4.11.
When running our scheduled performance tests, everything looked fine. Most of our application’s endpoints still provided response times of under 5 milliseconds. However, as the performance test progressed, we noticed our application’s response times increasing up to 20 milliseconds, and after a long running load test over the weekend, things got a lot worse. The response times skyrocketed to seconds - not good.
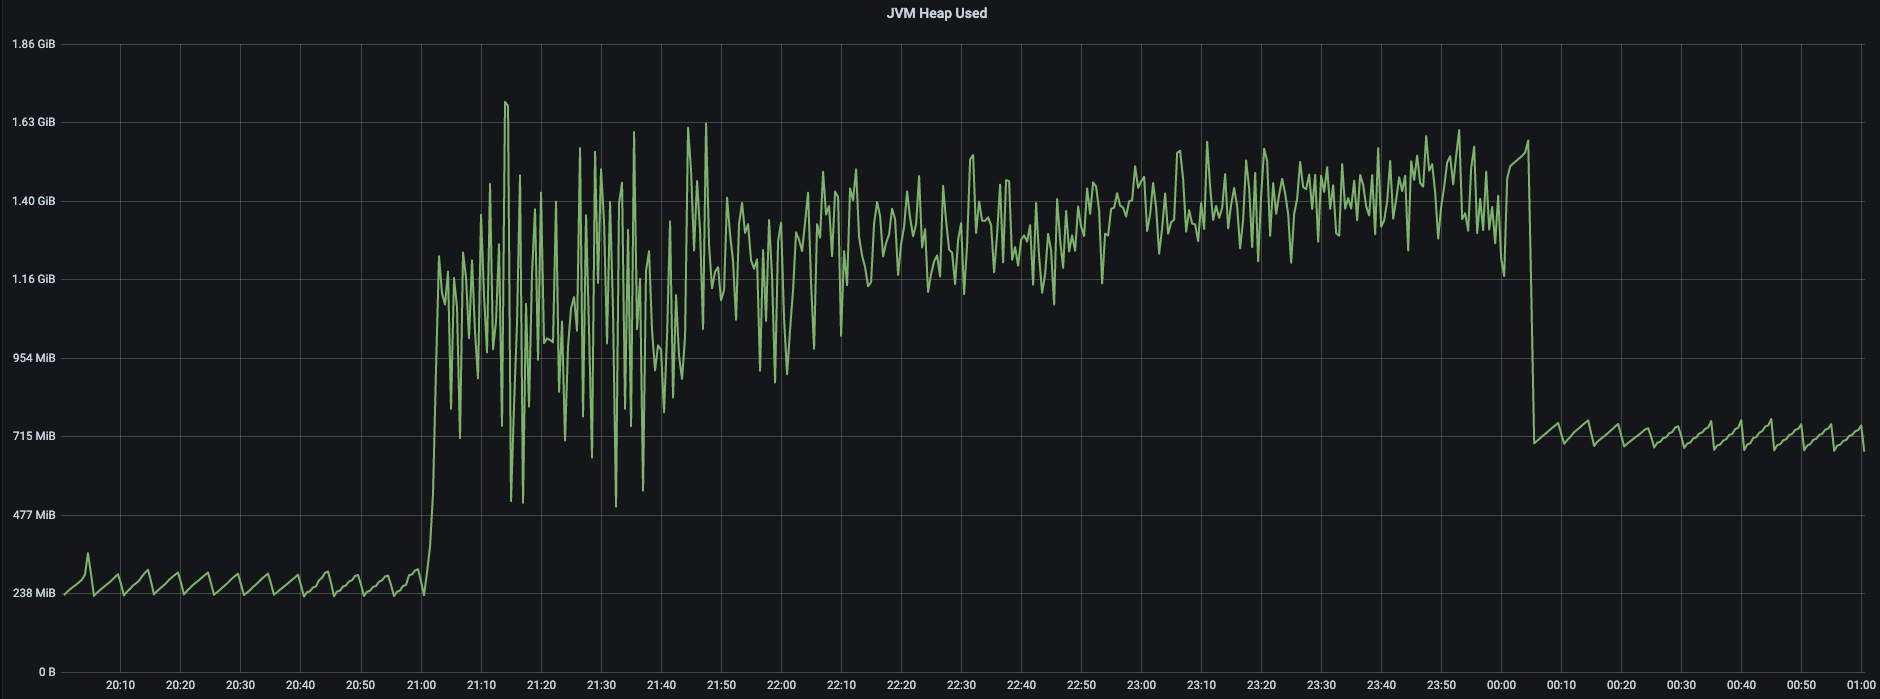
After a long stare down contest with our Grafana dashboards, which provide insights into our application’s CPU, thread and memory usage, this memory usage pattern caught our eye:

This graph shows the JVM heap size before, during, and after a performance test that ran from 21:00 to 0:00. During the performance test, the application created threads and objects to handle all incoming requests. So, the capricious line showing the memory usage during this period is exactly what we would expect. However, when the dust from the performance test settles down, we would expect the memory to also settle down to the same level as before, but it is actually higher. Does anyone else smell a memory leak?
Time to call in the MAT (Eclipse Memory Analyzer Tool) to find out what causes this memory leak.
What caused this memory leak?
To troubleshoot this memory leak we:
- Restarted the application.
- Performed a heap dump (a snapshot of all the objects that are in memory in the JVM at a certain moment).
- Triggered a performance test.
- Performed another heap dump once the test finishes.
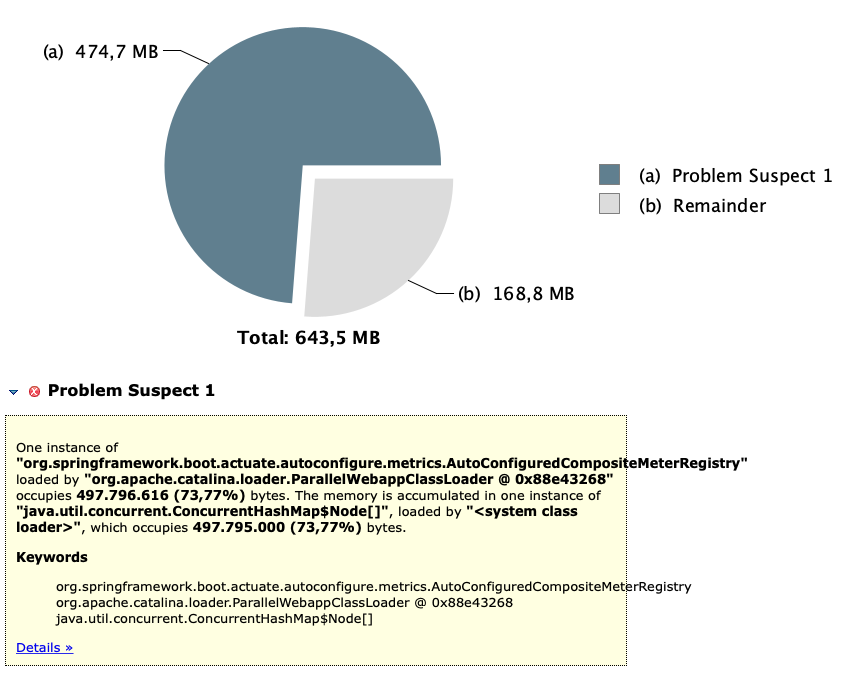
This allowed us to use MAT’s advanced feature to detect the leak suspects by comparing two heap dumps taken some time apart. But we didn’t have to go that far, since, the heap dump from after the test was enough for MAT to find something suspicious:

Here MAT tells us that one instance of Spring Boot’s AutoConfiguredCompositeMeterRegistry occupies almost 500MB, which is 74% of the total used heap size. It also tells us that it has a (concurrent) hashmap that is responsible for this. We’re almost there!
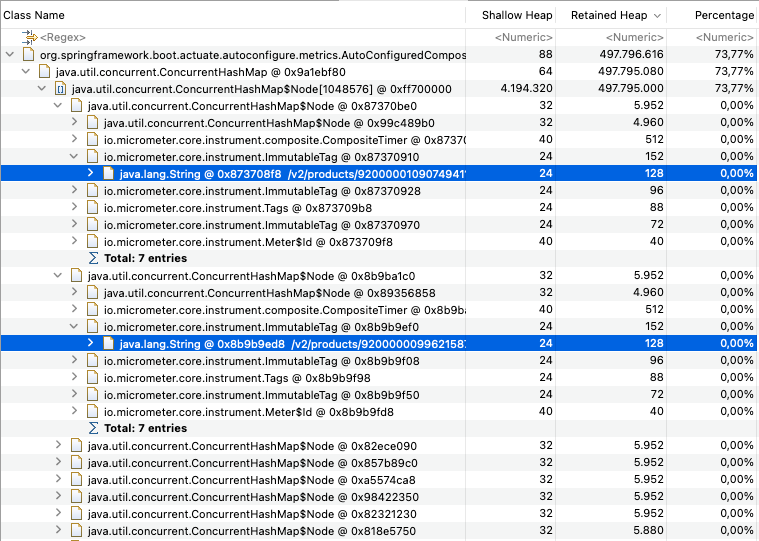
With MAT’s dominator tree feature, we can list the largest objects and see what they kept alive - That sounds useful, so let’s use it to have a peek at what’s inside of this humongous hashmap:

Using the dominator tree we were able to easily browse through the hashmap’s contents. In the above picture we opened two hashmap nodes. Here we see a lot of micrometer timers tagged with “v2/products/…” and a product id. Hmm, where have we seen that before?
What does WebClient have to do with this?
So, it’s Spring Boot’s metrics that are responsible for this memory leak, but what does WebClienthave to do with this? To find that out you really have to understand what causes Spring’s metrics to store all these timers.
Inspecting the implementation of AutoConfiguredCompositeMeterRegistrywe see that it stores the metrics in a hashmap named meterMap. So, let’s put a well-placed breakpoint on the spot where new entries are added and trigger our suspicious call our WebClientperforms to the “v2/product/{productId}” endpoint.
We run the application again and ... Gotcha! For each call the WebClientmakes to the “v2/product/{productId}” endpoint, we saw Spring creating a new Timerfor each unique instance of product identifier. Each such timer is then stored in the AutoConfiguredCompositeMeterRegistry bean. That explains why we see so many timers with tags like these:
/v2/products/9200000109074941 /v2/products/9200000099621587
How can you fix this memory leak?
Before we identify when this memory leak might affect you, let’s first explain how one would fix it. We’ve mentioned in the introduction, that by simply not using a URI builder to construct WebClient URLs, you can avoid this memory leak. Now we will explain why it works.
After a little online research we came across this post (https://rieckpil.de/expose-metrics-of-spring-webclient-using-spring-boot-actuator/) of Philip Riecks, in which he explains:
"As we usually want the templated URI string like "/todos/{id}" for reporting and not multiple metrics e.g. "/todos/1337" or "/todos/42" . The WebClient offers several ways to construct the URI [...], which you can all use, except one."
And that method is using the URI builder, coincidentally the one we’re using:
webClient .get()
          .uri(uriBuilder -> uriBuilder.path("/v2/products/{id}")
          .build(productId))
Riecks continues in his post that “[w]ith this solution the WebClient doesn’t know the URI template origin, as it gets passed the final URI.”
So the solution is as simple as using one of those other methods to pass in the URI, such that the WebClient WebClient gets passed the templated – and not the final – URI:
webClient .get() .uri("/v2/products/{id}", productId))Indeed, when we construct the URI like that, the memory leak disappears. Also, the response times are back to normal again.
When might the memory leak affect you? - a simple answer
Do you need to worry about this memory leak? Well, let’s start with the most obvious case. If your application exposes its HTTP client metrics, and uses a method that takes a URI builder to set a templated URI onto a WebClient, you should definitely be worried.
You can easily check if your application exposes http client metrics in two different ways:
- Inspecting the “/actuator/metrics/http.client.requests” endpoint of your Spring Boot application after your application made at least one external call. A 404 means your application does not expose them.
- Checking if the value of the application property management.metrics.enable.http.client.metrics is set to true, in which case your application does expose them.
However, this does not mean that you’re safe if you’re not exposing the HTTP client metrics. We’ve been passing templated URIs to the WebClient using a builder for ages, and we’ve never exposed our HTTP client metrics. Yet, all of a sudden this memory leak reared its ugly head after an application upgrade.
So, might this memory leak affect you then? Just don’t use URI builders with your WebClient and you should be protected against this potential memory leak. That would be the simple answer. You don't take simple answers? Fair enough, read on to find out what really caused this for us.
When might the memory leak affect you? - a more complete answer
So, how did a simple application upgrade cause this memory leak to rear its ugly head? Evidently, the addition of a transitive Prometheus (https://prometheus.io/) dependency – an open source monitoring and alerting framework – caused the memory leak in our particular case. To understand why, let's go back to the situation before we added Prometheus.
Before we dragged in the Prometheus library, we pushed our metrics to statsd (https://github.com/statsd/statsd) - a network daemon that listens to and aggregates application metrics sent over UDP or TCP. The StatsdMeterRegistry that is part of the Spring framework is responsible for pushing metrics to statsd. The StatsdMeterRegistry only pushes metrics that are not filtered out by a MeterFilter. The management.metrics.enable.http.client.metrics property is an example of such a MeterFilter. In other words, if
management.metrics.enable.http.client.metrics = false the StatsdMeterRegistry won't push any HTTP client metric to statsd and won't store these metrics in memory either. So far, so good.
By adding the transitive Prometheus dependency, we added yet another meter registry to our application, the PrometheusMeterRegistry. When there is more than one meter registry to expose metrics to, Spring instantiates a CompositeMeterRegistry bean. This bean keeps track of all individual meter registries, collects all metrics and forwards them to all the delegates it holds. It is the addition of this bean that caused the trouble.
The issue is that MeterFilter instances aren't applied to the CompositeMeterRegistry, but only to MeterRegistry instances in the CompositeMeterRegistry (See this commit for more information.) That explains why theAutoConfiguredCompositeMeterRegistryaccumulates all the HTTP client metrics in memory, even when we explicitly set management.metrics.enable.http.client.metricsto false.
Still confused? No worries, just don’t use URI builders with your WebClient and you should be protected against this memory leak.
Conclusion
In this blog post we explained that this approach of defining URLs of your request with Spring Boot's WebClient is best avoided:
webClient .get()
          .uri(uriBuilder -> uriBuilder.path("/v2/products/{id}")
          .build(productId))
We showed that this approach - which you might have come across in some online tutorial - is prone to memory leaks. We elaborated on why these memory leaks happen and that they can be avoided by defining parameterised request URLs like this:
webClient .get() .uri("/v2/products/{id}", productId))