Moving to the cloud? Don't let your application become a downer!
Introduction
At bol.com we have two main ways of running our applications. We can deploy them in a Datacenter (DC) managed by us or we can run them on Google Cloud Platform (GCP). Many applications are being migrated from DC to the GCP to take advantage of the different products available in GCP. Switching to the cloud isn't just a matter of lift 'n shifting your application though, there are several changes that you should take into account.
One of those changes is, how the behavior of the underlying platform impacts the application uptime. Applications running in DC are running on stable (virtual) machines so it is expected to see high uptimes. Downtime should happen only due to scheduled maintenance (s).
GCP is a different story, one of the big advantages of running in the cloud is elastic resources. Scale-up when you need more machines and pay more, scale down when you need fewer machines and pay less. This means applications, even those that don't do any scaling themselves, will run on (virtual) machines that are much more prone to be restarted. Our applications need to be configured carefully if we want to see the same uptime in GCP as we have in our DC.
In this article, I will explain how we tested our application and made sure that it is resilient by handling many types of restarts gracefully when running in GCP and on Kubernetes specifically.
So what kind of application are we testing?
The application itself runs on Google's managed Kubernetes (GKE) service. We can deploy the application via spec files. These spec files are written in YAML and define how and where Kubernetes will run the application. You will see snippets of these spec files throughout this article.
As for the application itself, we will be looking at a fairly simple Springboot application. It connects to a CloudSQL database and interaction with the application happens through REST endpoints. We'll be using the endpoints to determine if our application is up and running.
Lastly, a big part of running applications in the cloud is to be mindful of our cost footprint, in other words: how many euros does it cost to run the application. So we will run our application on preemptible nodes. Preemptible nodes are much cheaper to run on (~70% discount) but have the downside of being restarted every 24 hours.
The testing method
Our testing setup consists of a few factors. An environment to run it on, generating traffic to measure the health of the application, and being able to simulate failure scenarios.
I ran our tests on our staging environment to provide some isolation when running the test. Therefore, I needed to generate traffic and be able to detect if our application was not healthy at any point in time. To generate this traffic I used the tool locust.io. Locust can be used for load or stress testing but the way it reports success and failure rates allow us to easily see if at any moment the application is or is not healthy.
Locust is a program written in python and we can easily run it on Kubernetes using their prebuilt docker images. We need to define which endpoints to call and then tell Locust how often to call the endpoints.
First, we create a configmap for Kubernetes, this will allow us to define how locust should be using our service:
apiVersion: v1
kind: ConfigMap
metadata:
  name: locust-file
data:
  locustfile.py: |
    import time
    from locust import HttpUser, task


    class QuickstartUser(HttpUser):
        @task(3)
        def view_item(self):
            self.client.get("/v1/head-office/69599084")
This creates a configmap with an entry called locusfile.py. This is a python file that is basically saying: do a GET request on the endpoint "/v1/head-office/69599084". This is the endpoint that we're gonna test. If you want, you could randomize id's here, make POST calls with a certain payload or do other tasks for which you need to call your endpoints.
Next, we need a Kubernetes resource for locust.io itself so it can actually start making the requests:
apiVersion: "apps/v1"
kind: "Deployment"
metadata:
  name: locust-master
  labels:
    name: locust-master
spec:
  replicas: 1
  selector:
    matchLabels:
      app: locust-master
  template:
    metadata:
      labels:
        app: locust-master
    spec:
      imagePullSecrets:
      - name: imagepull
      securityContext:
        fsGroup: 1000
        runAsUser: 1000
      containers:
        - name: locust-master
          image: locustio/locust:latest
          command: <"locust">
          args: <"--locustfile", "/locust-file/locustfile.py">
          ports:
            - name: loc-master-web
              containerPort: 8089
              protocol: TCP
          volumeMounts:
          - name: locust-file
            mountPath: /locust-file/
      volumes:
        - name: locust-file
          configMap:
            name: locust-file
I deploy both these resources to Kubernetes by executing the following in a shell terminal:
kubectl apply -f configmap.yaml
kubectl apply -f locust.yaml
Then to access the locust web UI, I forwarded the port to my local laptop like this:
kubectl port-forward locust-master-5969c8bdf8-t5s5b 8089(locust-master-5969c8bdf8-t5s5b refers to the pod name, this will be different for every new pod)
Going to http://localhost:8089 gave me the following:
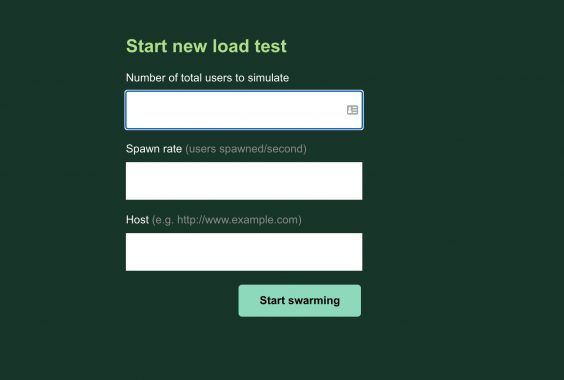
Perfect! So locus is now up and running and via this screen, I can specify where and how many requests I want to send to our application, and locust will report if any of those requests failed.
We are now ready to start testing! Let's make sure everything is working correctly by creating a negative and positive test.
First the negative test, I've shut down the entire application and as expected this shows me that indeed all the requests are failing. 443.2 total requests per second and 443.2 failures per second.
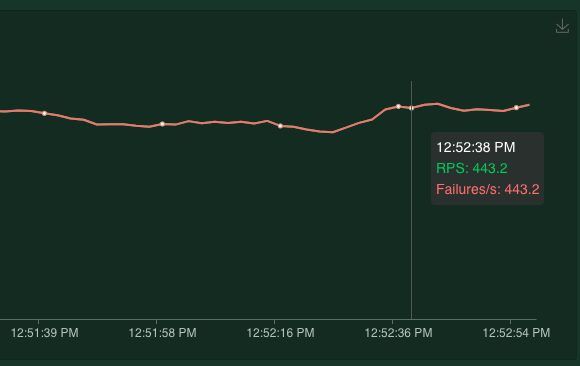
Green (RPS) means requests per second and Red stands for Failures per second.
Next, let's see the result when the application is healthy. After spinning up one pod I clearly see the failure rate dropping to zero meaning all requests done are successful and our application is healthy!
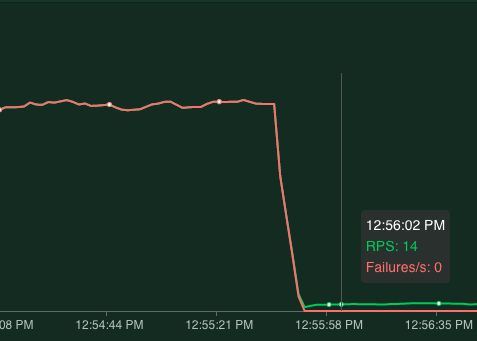
Note: the RPS now drops to 14. This is because successful requests take longer to process than a 'connection error' that occurred when all pods are down.
Now that we have our test-setup ready, let's replicate some of the failure scenarios that can and will happen on Kubernetes and see how our application reacts to it.
Scenarios
We started by identifying the failure scenarios we want to test:
- Pod restart
- Scheduled pod restart (deployment)
- Node restart
- GCP Zone & Region outage
Basically, we identified all single points of failure. Then, for each of these scenarios we force a failure (or simulate best we can), measure what happens when that single point of failure breaks, implement a way to cope with it, and finally test that if we are now resilient against it.
Scenario 1 - Pod Restart
Kubernetes can restart your pod for many reasons, for instance, because there is room on another VM or perhaps because the node your pod is running on is overloaded. I will mimic this by simply killing the pod.
kubectl delete pod <pod-name>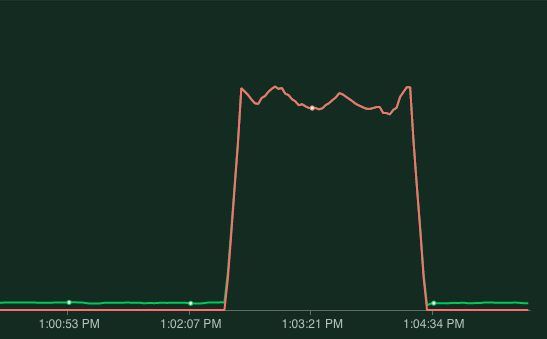
Locust clearly shows when the pod was down. This means when our pod gets killed, our application will be unavailable for more than two minutes! This is easily fixed through redundancy, instead of having just one pod let's spin up two pods and run the test again by killing the pod again.
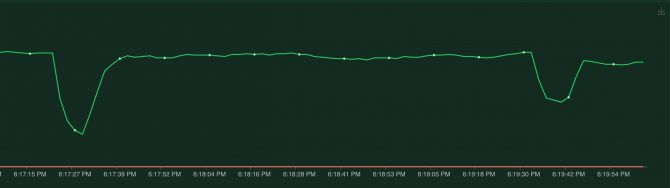
The first dip is killing one of the two pods, this is probably the loadbalancer trying to reach the pod that is down, taking a second to realize the pod is unavailable and then switching to the other healthy pod. The second dip is when the second pod comes back up. Notice that at all times the failure rate remains 0, so no requests got lost!
Scenario 2 - Scheduled pod restart (deployment)
Now that we've got redundancy, deploying should go without a hiccup right? Well, let's test it to be sure! I will mimic a deployment by executing:
kubectl rollout restart deployment/my-appThis will cause every pod to be replaced by a new pod, one by one.
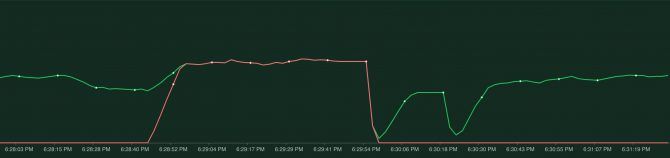
So that didn't work out..what actually happened here? "kubectl rollout restart" will make sure there are always two pods running. Meaning it will spin up a new pod, wait for it to be ready, and then shutdown the 'old' pod.
However, just because a pod is running doesn't mean it is actually ready to process requests. For instance, Spring Boot takes a bit of time to start up and only after it has fully started up is it ready to accept incoming requests. When the pod has been scheduled and started, Kubernetes immediately considers it ready. This is not what we want, we have to tell Kubernetes that it takes a while before our pod is actually ready to accept requests. This is where the readinessProbe comes into action, a readiness probe allows Kubernetes to poll the pod and not consider it ready to receive requests until the application indicates it is ready. For spring boot a readiness probe like this works well:
readinessProbe: # if readiness probe fails, is taken out of your loadbalancer
initialDelaySeconds: 15 #adjust this to be a little less than the time it normally takes for your application to startup
httpGet:
path: /internal/health
port: 8080
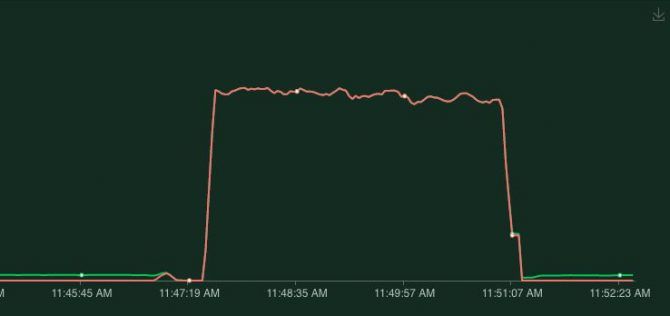
timeoutSeconds: 3After adding this the result of a deployment looks like this.
No failed requests, the application can handle deployments gracefully now!
Scenario 3 - Node shutdown
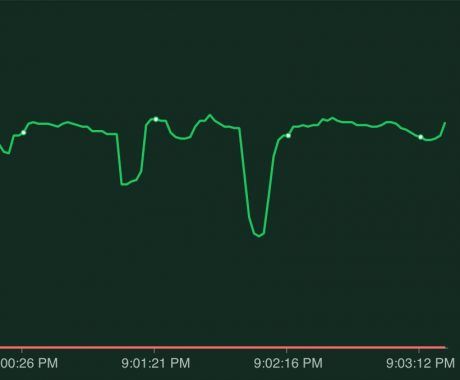
The final scenario is when a node shutdown happens. This can happen because Kubernetes wants to scale down the number of nodes or because we're running our pods on preemptible nodes and one of the daily restarts occurs. If we're lucky our pods are spread over multiple nodes but it's also very likely the pods have been scheduled on the same node. If that's the case we'll see the following behavior:
Because both pods were running on the same node, when that node is stopped both pods went down and we had a lot of downtime. The solution would be, to not run our pods on the same node.
Fortunately, Kubernetes has a solution for this: podAntiAffinity. With podAntiAffinity, you can tell Kubernetes you don't want pods to be grouped together on the same node. We can achieve that by adding the following to our Kubernetes spec file:
spec:
  affinity:
    podAntiAffinity:
      requiredDuringSchedulingIgnoredDuringExecution:
      - labelSelector:
          matchExpressions:
          - key: app
            operator: In
            values:
            - app-name
        topologyKey: kubernetes.io/hostname
With this applied after a node restart we indeed see the following behavior:
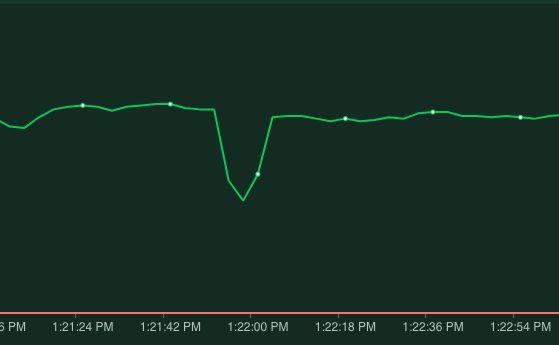
A slight dip in response time before the load balancer becomes aware that the pod has shut down but no failed requests!
Scenario 4 - Zone & region outage
A zone and region outages are slightly more difficult to simulate as you will need to make changes to your Kubernetes cluster setup, see this article for tips on how to simulate this.
Applications can be made resilient against these failures via the podAntiAffinity. In Scenario 3, when we used podAntiAffinity a topologyKey was defined, it was set to "kubernetes.io/hostname". This hostname label is a unique label per node and thus ensures our pods are always on unique nodes. If we want to be able to handle zone of region outages without any downtime you could use a different toplogyKey. For zone that would be "topology.kubernetes.io/zone" and for region it would be "topology.kubernetes.io/region". This would ensure our pods are running in unique zones (or regions) and just like with the node if the zone would go down our other pods would keep on running in a different zone.
There is one downside to this approach, you can only have as many pods as you have toplogyKeys. In this case, that means you can have only as many pods as you have zones or regions. At bol.com we have a multi-zonal cluster that helps us deal with any zone outages. Even though that would not be without a loss of uptime, it does strike a nice balance between flexibility and resiliency.
Concluding
Running applications on Kubernetes means you have to make sure your application can cope with restarts. We can achieve this through:
- Redundancy
- Informing Kubernetes when your pods are ready to receive traffic
- Prevent single point of failures such as running on a single node
To me, it was a very useful exercise. Going through identified failure scenarios, see if and how it impacted my application. Apply fixes and watch how they made the application more and more resilient.
I would definitely encourage those of you running applications in Kubernetes to do the same!