How to: validate your app's metrics on a local Grafana instance
Monitoring your infrastructure is key for keeping production workloads healthy and to debug issues when things are going bad. And like Peter Drucker once said: “if you can measure, you can manage”. At bol.com, we make use of the well-known Prometheus / Grafana stack.
Recently I needed to add new metrics to my application. So I opened my visual studio code instance and added a few new measurements. After this, I had the need to validate them, but then I realised I had to push my code changes up to the staging environment before I could really see what they looked like in an actual plotted Grafana graph.
Running a local stack
So I decided to fix this once and for all by creating a docker-compose project which spins up a local grafana/prometheus stack. You can download an archive with the files here. Extract them somewhere on your development machine. Amongst other things, the archive contains a docker-compose file that looks like this:
version: "3.9"

services:

  prometheus:
    container_name: prometheus
    image: prom/prometheus:latest
    restart: unless-stopped
    tty: true
    ports:
      - 9090:9090
    volumes:
      - ${PWD}/prometheus/config/prometheus.yml:/etc/prometheus/prometheus.yml
      - ${PWD}/prometheus/data:/prometheus
    command: "--config.file=/etc/prometheus/prometheus.yml --storage.tsdb.retention.time=1y --web.enable-admin-api"
    depends_on:
      - node-exporter

  grafana:
    container_name: grafana
    image: grafana/grafana
    restart: unless-stopped
    tty: true
    depends_on:
      - prometheus
    ports:
      - 3000:3000
    volumes:
      - ${PWD}/grafana/runtime-data:/var/lib/grafana
      - ${PWD}/grafana/datasources/datasource.yml:/etc/grafana/provisioning/datasources/datasource.yml
    environment:
      - GF_SERVER_ROOT_URL=https://localhost
      - GF_SECURITY_ADMIN_USER=foo
      - GF_SECURITY_ADMIN_PASSWORD=bar
      - GF_USERS_ALLOW_SIGN_UP=false

  node-exporter:
    container_name: node-exporter
    image: quay.io/prometheus/node-exporter:latest
    restart: unless-stopped
    tty: true
    ports:
      - 9100:9100
What will I be running here?
As you can see the docker-compose file defines three containers.
- First of all, it defines a prometheus server. This is the service that has the responsibility to "scrape" all the metrics from the landscape.
- Then we have Grafana, which can be used to plot the data collected by prometheus into nice graphs.
- With these two containers we can scrape and plot metrics. However, at this point we don't yet have any metrics to scrape. No worries, we'll get there soon. To already test the setup we have so far, we add a third container that collects local metrics from your development machine and makes them "scrapable" for prometheus. Again: we only use this container to test if the stack as a whole is working correctly. So when you've set it all up, you can get rid of this
node-exporterservice.
How to run
- Go to the directory where you extracted the files.
- Run docker-compose:
docker compose up. - Wait until all docker images are downloaded and started.
- Then the following endpoints should be available:
- Prometheus: http://localhost:9090. A list of all the targets which are being scraped can be found here: http://localhost:9090/targets
- Grafana: http://localhost:3000/ (login with username
fooand passwordbar, as defined in the prometheus.yml file. - The metrics endpoint of the local node-exporter: http://localhost:9100/metrics
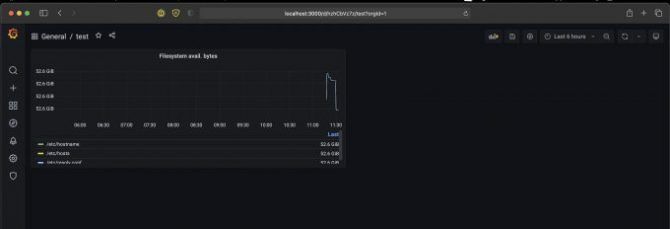
- The grafana instance comes with a
test-dashboard, which displays data out of the node-exporter. See below screenshot.
How to add your own local service
- Simple: add a prometheus/metrics endpoint to your application. More information on that can be found here. Then change the prometheus.yml file and add a new target, pointing to your local service:
  - job_name: "my-local-service"
    scrape_interval: 1s
    metrics_path: "/metrics"
    static_configs:
      - targets: <"host.docker.internal:8080">
- This assumes that your service is running on port 8080.
- Restart the docker-compose stack and check the "targets"-endpoint to see if your service is being scraped correctly.
- If so, wait a few minutes so the metrics can arrive
- Visualise them in Grafana
More information and/or improvements?
Please help improve this by starting a merge request / issue on our public repository.
Thanks!
Rogier Lommers